
I do! I love a mystery. Be forewarned: this article is outside my qualifications or skill set – I just want to share the mystery. My interest in this mystery is, IF (and this is a big “if” at this point) wearables can detect increases in inflammation from monitoring various physiological metrics, how useful could that be to so many of us with inflammatory conditions?
As regular readers know, this has not been the best health year for me – not actually major bad things, but not exactly climbing Mount Everest either. To catch up a little for context, check out The Tangled Web of Chronic Illness.
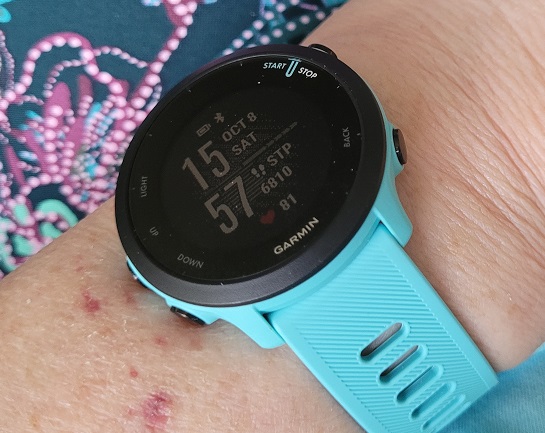
Earlier this year, I bought a Garmin Forerunner 55 sports watch. I got it on special, just for the record. Now, I was rather upset to discover they’d stolen MY idea of an internal battery, just renamed it Body Battery. (No, I don’t really think they stole my idea).
It was interesting indeed. Here was I not feeling too crash hot and my watch was telling me my body was very physically stressed even when I lying in bed asleep. Here is December 14 as an example of the type of day I was seeing.

The orange bars are physical stress (draining), the blue are rest (recharging). Out of a max of 100, my battery reached a high of 33 that day and dropped to a low of 13.
What, I wondered, was this trying to tell me? My doctors weren’t very interested. It’s not a medical device, after all. Well, they may not be interested, but I am.
The watch is very accurate with other measurements: kilometres walked, GPS, step count. But was it perhaps faulty in this respect?
The first question I had was how is Garmin calculating this? Click the pic to read the full article
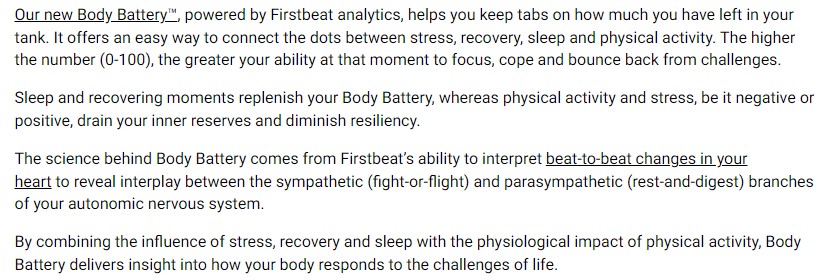
I read several of the related publications, just chose the above to share here.
I was convinced my watch was telling me something. I even logged a support ticket with Garmin (still in progress as I write) but I have now decided the watch is onto something. That something MAY be inflammation.
Let’s move forward to the end of December, when I was having quite a bit of pain. After two rheumatologist visits and two GP visits between December 22 and January 3 and a steroid shot in one wrist AND (this is the kicker I think) starting on anti-inflammatory medication on Wednesday January 3, all of a sudden my body battery looks much more like I would expect it to look. Here is yesterday’s report! Compare the pair!

Yesterday I did stuff aside from walking. I did a big grocery shop, put all the groceries away, I worked in the afternoon and before lunch. I can match those orange periods on the graph with what I was doing during the day. I could not do that in December. Not only that, I reached a high of 85! 85! The low of 8 was at midnight.
Stunned I was! The only explanation I can come up with at this point is the anti-inflammatories. Started on Wednesday, took a couple of days to kick in. Plus, of course, I have started my new PsA medication and it will be hopefully starting to work behind the scenes as well.
This morning is looking very similar. By the time I woke up my battery was charged to 93!

Now, as I type this, I have used up some energy. I was out walking at 7:30 am this morning. I haven’t felt like doing THAT at 7:30 am for months. 2.5 kilometres, for anyone keeping tabs. As we know, over Christmas it was taking me until about 10 am to desolidify enough to walk.

Now, two days does not solve a mystery. I might be 100% incorrect in my deliberations. However, I’m sure you’ll agree it is very interesting. Is it not? I will be monitoring progress to see what happens from here on in.
Yes, I have updated my Garmin support ticket with this new information. I’m finding this quite intriguing!
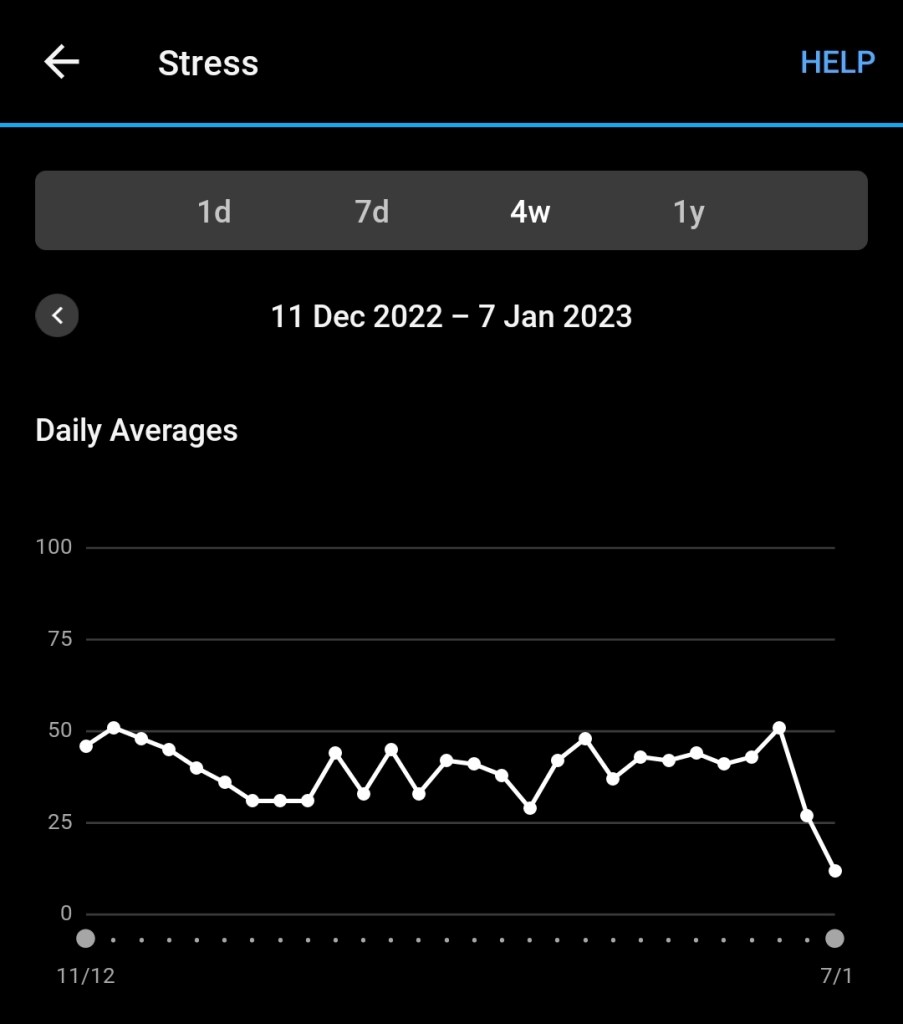
One more graph. Garmin also provide a graph of your average physical stress over the days. Look what has happened.

[…] what I call our internal battery, I stated I didn’t have a charge meter on my arm! I do now: my Garmin watch. Here it is for yesterday (Saturday) compared with Thursday. For whatever reason, I hadn’t […]
LikeLike